Technical Graphing
Advertisement
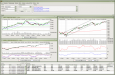
Lidgren Technical Stock Analyzer v.0.93
Purpose: To make an easy to install, easy to use technical stock analyzer with some unusual powerful indicators.
Advertisement
TA-Lib: Technical Analysis Library v.b.0.4.0
Technical analysis library with indicators like ADX, MACD, RSI, Stochastic, TRIX.
MITCalc-Technical Formulas v.1 17
Excel workbook contains solutions to dozens of basic formulas from physics, technology and mechanical engineering.
Stock Screener Lite
Screen, Scan & Filter Stocks, covers over 30 stock exchange, Technical Analysis. MACD, RSI, Moving Average, CCI, Williams %R, MFI. 4 build in filters and FREE EOD Data for 38 stock exchange worldwide. Filter include Moving Average 1 Crossover Moving
VectorEngineer Quick Tools
VectorEngineer Quick-Tools is a complete technical drawing and multi-purpose cad software system that offers all the features required to create accurate professional drawings, working drawings, designs, plans, layouts and diagrams in a quick and easy

TickInvest Free Edition v.1.2.0
TickInvest is a stock charting and technical analysis software with realtime and eod charts. 29 Indicators are ready to use, to analyze your favorite stocks. Drawing tools helps you to keep track of resistance and support zones.
TickInvest Free Edition for Linux v.1.0.0
Stock charting and technical analysis software with a user-friendly interface targeted for stock investors and realtime traders. Supported dataproviders are Yahoo and Interactive Brokers. Realtimecharts, Indicators, Easy to use script language...
TradingSolutions v.4.08.0403
TradingSolutions is a financial analysis software package that combines traditional technical analysis with state-of-the-art artificial intelligence technologies.
Atlantis Schema Surf v.1. 1. 1942
Atlantis Schema Surf is our SQL dependency & live entity ER diagram tool - it is a free animated graphing tool which allows you to easily visualize the dependencies between the objects in your SQL Server databases in a live entity ER diagram.
Atlantis Data Surf v.1. 1. 1935
Atlantis Data Surf is Atlantis Interactive SQL visualization tool - it is a free animated graphing tool which allows you to easily visualize complex schemas - use it to 'surf' through your data.
WinTrend v.3.10.5.40
WinTrend is providing high quality Real-time and Historical Charting and Technical Analysis for the financial markets. Supports all types of markets: stocks, futures, indexes, spreds, currencies and options.